Dev Update—Debugging the Memory Leak in Tendermint

I have spent the last week looking for clues and writing test cases in order to find and fix the memory leak in Tendermint. For those of you who don’t know, Tendermint Core is a Byzantine Fault Tolerant (BFT) middleware that takes a state transition machine — written in any programming language — and securely replicates it on many machines. It is also the foundation of Cosmos — our solution for scaling blockchains.
Finding a memory leak in Go is not an easy task. However, there is a common set of questions, answers to which will hopefully help you identify the source of a leak. Here is the list:
Detecting, Troubleshooting, and Fixing a Memory Leak in Go
The immediate questions to ask are:
- Where is memory leaking to? (
go tool pprofwith-baseflag) - Why is new memory being allocated? (code specific)
- Is the number of goroutines growing or not? (
runtime.NumGoroutine()) - If the number of goroutines is growing, which of them are new? (leaktest or
pprof.Lookup("goroutine").WriteTo(os.Stdout, 1)) - If the number of goroutines is not growing, what object(s) hold a reference to the leaking memory? (
go tool pprofwith-baseflag and reading code)
If you want to know the whole story, please keep reading.
Part 1. Discovery
It all started with one of our users reporting a memory leak (thanks Martin), while he was trying to sync with the latest testnet (gaia-2). And 615MB after just a few minutes at block ~230k certainly does sound like one. Jeez!
First thing I did is try to replicate this manually by spinning up a new node and connecting to the same testnet. I took advantage of existing http://localhost:46657/write_heap_profile?filename=_ RPC endpoint and created two heap dumps: one at the start, another after approximately 10 minutes of syncing. Then I compared them using go tool pprof .
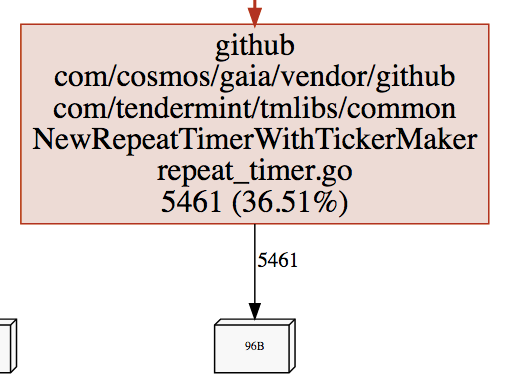
go tool pprof -base /tmp/mem1.mprof /tmp/mem2.mprofImmediately I noticed a lot of memory is occupied by newChannel and RepeatTimer. The trail went all the way up to the reconnectToPeer function. That was weird because we’re not creating any new peers (some of them were just failing due to timeouts and Tendermint tried to reconnect).

Part 2. Mistake
Here I made a mistake. I thought I pinpointed the exact place where the memory is leaking. So I went and wrote a test case for p2p/Switch, where I create a peer, close the connection (simulate a timeout), wait until Tendermint reconnects and repeat this 100 times. Before and after, I took snapshots of the heap and later used them to find where memory is going.
The test-case looked like this:
// memory heap before
f, err := os.Create(“/tmp/mem1.mprof”)
if err != nil {
  t.Fatal(err)
}
pprof.WriteHeapProfile(f)
f.Close()
// create a peer
// simulate failure by closing the connection
// wait until Tendermint reconnects to peer
// repeat 100 times
// call GC manually
runtime.GC()
// memory heap after
f, err := os.Create(“/tmp/mem2.mprof”)
if err != nil {
  t.Fatal(err)
}
pprof.WriteHeapProfile(f)
f.Close()
Indeed, the test showed leaking newChannel and RepeatTimer. But I still had no clue about why this was happening. I spent a few days reading various resources and source code, trying different instruments and asking people for advice on StackOverflow.
One advice was particularly interesting: look for running goroutines. So at the end of the test, I added:
time.Sleep(10 * time.Second)
pprof.Lookup(“goroutine”).WriteTo(os.Stdout, 1)
In the process, I also discovered a great tool — leaktest, which does almost the same, except it removes runtime and testing related goroutines, so it’s easy to spot leaking goroutines. Plus it makes a test fail if in the end there are still some goroutines running.
No useful results. However, now I knew it was not goroutines that were the issue. I figured out there must be something wrong with my test case. Of course! How could I be so stupid? The culprit was testing using TestReactor (spy), which keeps track of peers and does not remove them.
tr.peersAdded = append(tr.peersAdded, peer)TestReactor was the one holding reference to all peers (both added and removed). This is why Go was not able to garbage collect them.
The mistake I was talking above was jumping to a unit test instead of writing an integration test. Then it all became clear. I knew what I needed to do. I should have written the same test case but for the whole program (basically wrapping main.main()) rather than something, which is using a spy (TestReactor).
Part 3. Happy Ending
In case of Tendermint, the entry point (analogue of main.main() ) is creating and running a Node .
// create & start node
n, err := DefaultNewNode(config, log.TestingLogger())
...// memory heap before
f, err := os.Create(“/tmp/mem1.mprof”)
if err != nil {
  t.Fatal(err)
}
pprof.WriteHeapProfile(f)
f.Close()// stop a peer 100 times// call GC manually
runtime.GC()// memory heap after
f, err := os.Create(“/tmp/mem2.mprof”)
if err != nil {
  t.Fatal(err)
}
pprof.WriteHeapProfile(f)
f.Close()// stop node
n.Stop()// dump all running goroutines
time.Sleep(10 * time.Second)
pprof.Lookup(“goroutine”).WriteTo(os.Stdout, 1)
2 minutes later I discovered the real reason:
114 @ 0x42f2bc 0x42f3ae 0x440794 0x4403b9 0x468002 0x9fe32d 0x9ff78f 0xa025ed 0x45e571# 0x4403b8 sync.runtime_Semacquire+0x38 /usr/lib/go-1.9/src/runtime/sema.go:56
# 0x468001 sync.(*WaitGroup).Wait+0x71 /usr/lib/go-1.9/src/sync/waitgroup.go:131
# 0x9fe32c github.com/tendermint/tendermint/vendor/github.com/tendermint/tmlibs/clist.(*CList).FrontWait+0x2c /home/vagrant/go/src/github.com/tendermint/tendermint/vendor/github.com/tendermint/tmlibs/clist/clist.go:233
# 0x9ff78e github.com/tendermint/tendermint/mempool.(*Mempool).TxsFrontWait+0x2e /home/vagrant/go/src/github.com/tendermint/tendermint/mempool/mempool.go:184
# 0xa025ec github.com/tendermint/tendermint/mempool.(*MempoolReactor).broadcastTxRoutine+0x25c /home/vagrant/go/src/github.com/tendermint/tendermint/mempool/reactor.go:120
MempoolReactor creates a broadcast routine for each peer. It can block on an empty CList forever unless there are transactions coming in. And since there are no transactions during sync, this goroutine will just sit there, holding onto the peer too. If we’re constantly reconnecting to some peer, old instances are not garbage collected, leading to the memory leak.
The leak was successfully fixed and included in the next release of Tendermint (0.16).
Lessons learned:
- avoid unnecessary blocking
- use leaktest in integration tests (especially if code is spawning new goroutines)
Resources: